Free maintenance templates in Excel
A maintenance log, preventive maintenance schedule, inspection checklist, root cause analysis (5 whys) log, calibration record and spare parts register. Six workbooks with formulas, dropdown lists, built-in checks and live dashboards. Enter your own records; the previews are filled with fictional example data so you can see what each dashboard shows.
- 6 workbooks
- 500 rows each
- 5 sheets each
- Free to use. No sign-up.
XPreventive maintenance plannerACTUAL SHEET
DashboardRecordsView sheet ↗
EXCEL .XLSXBlank records
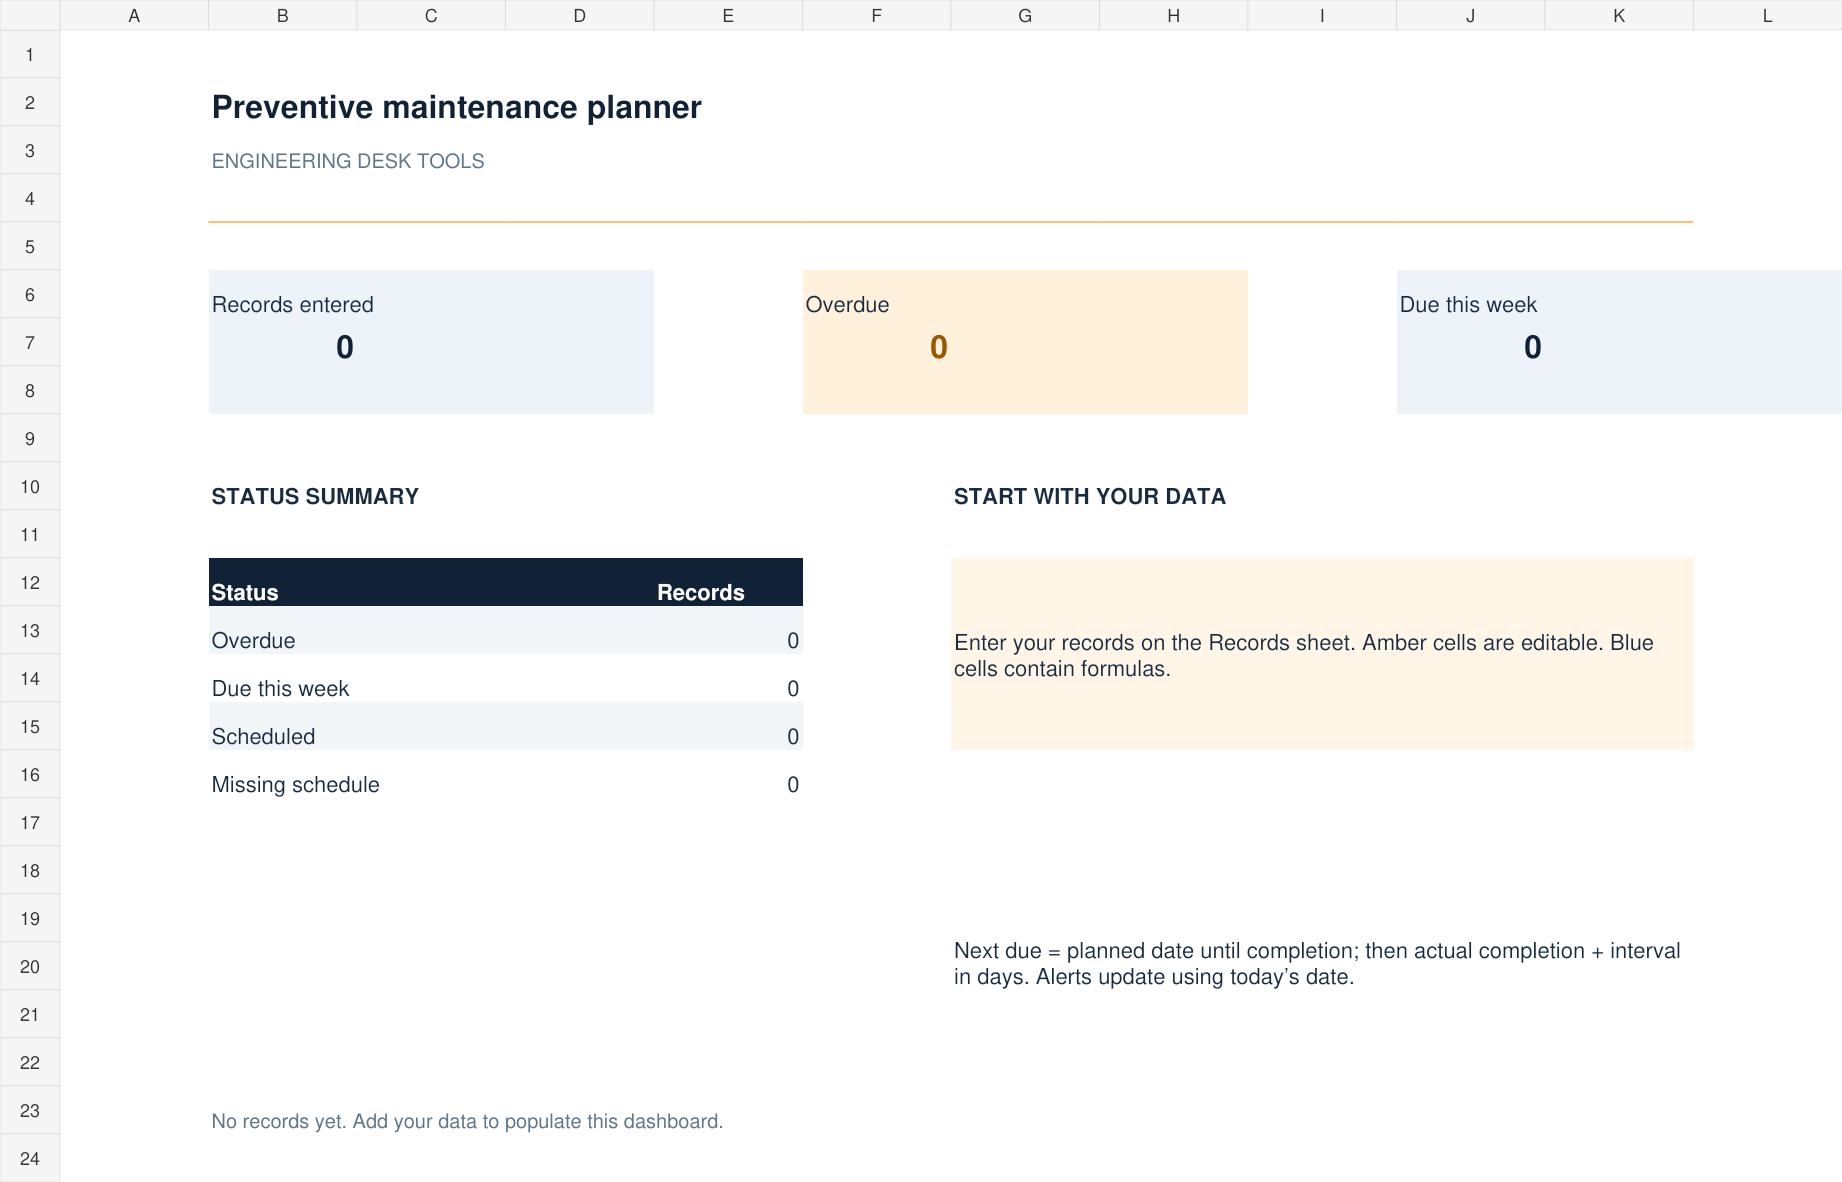
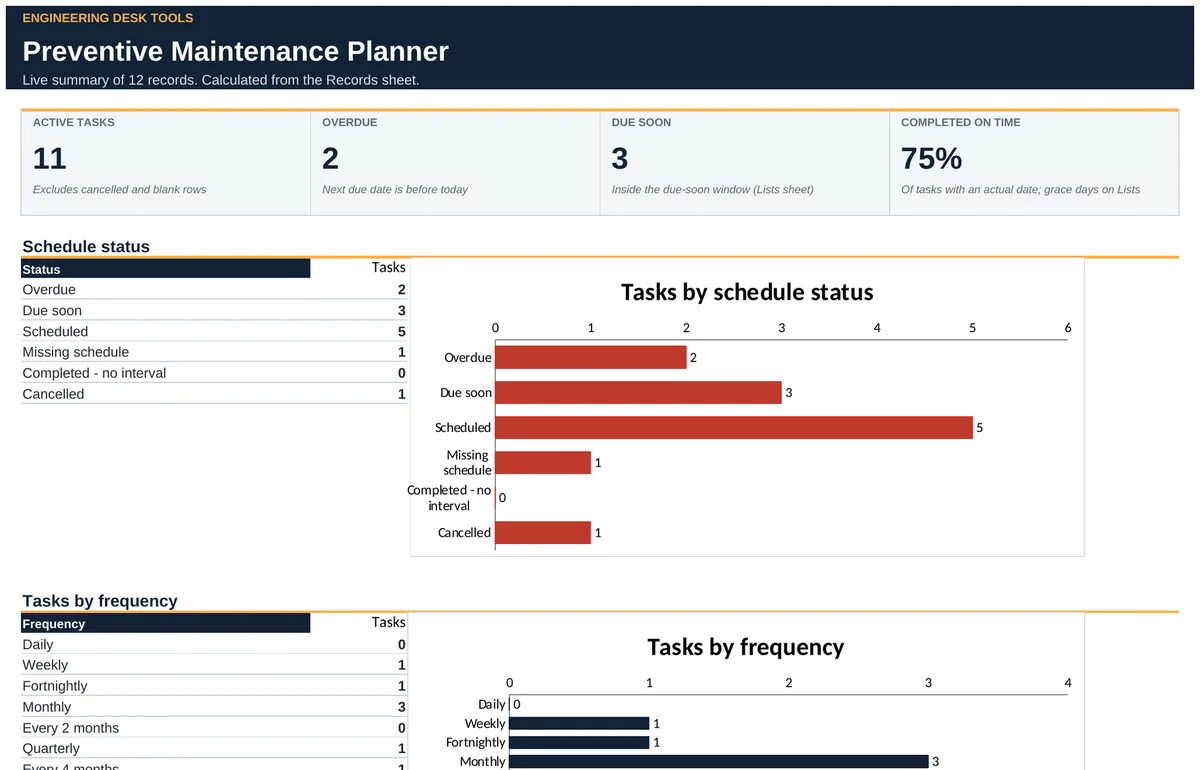
Preventive maintenance schedule template
Schedule recurring PM tasks by frequency, see what is overdue or due soon, and track on-time completion.
Next due datesOverdue alertsOn-time rateTop 10 overdue
Download Excel ↓Free · 500 rows · 5 sheetsFilled example with sample data ↓XBreakdown & downtime logACTUAL SHEET
DashboardRecordsView sheet ↗
EXCEL .XLSXBlank records
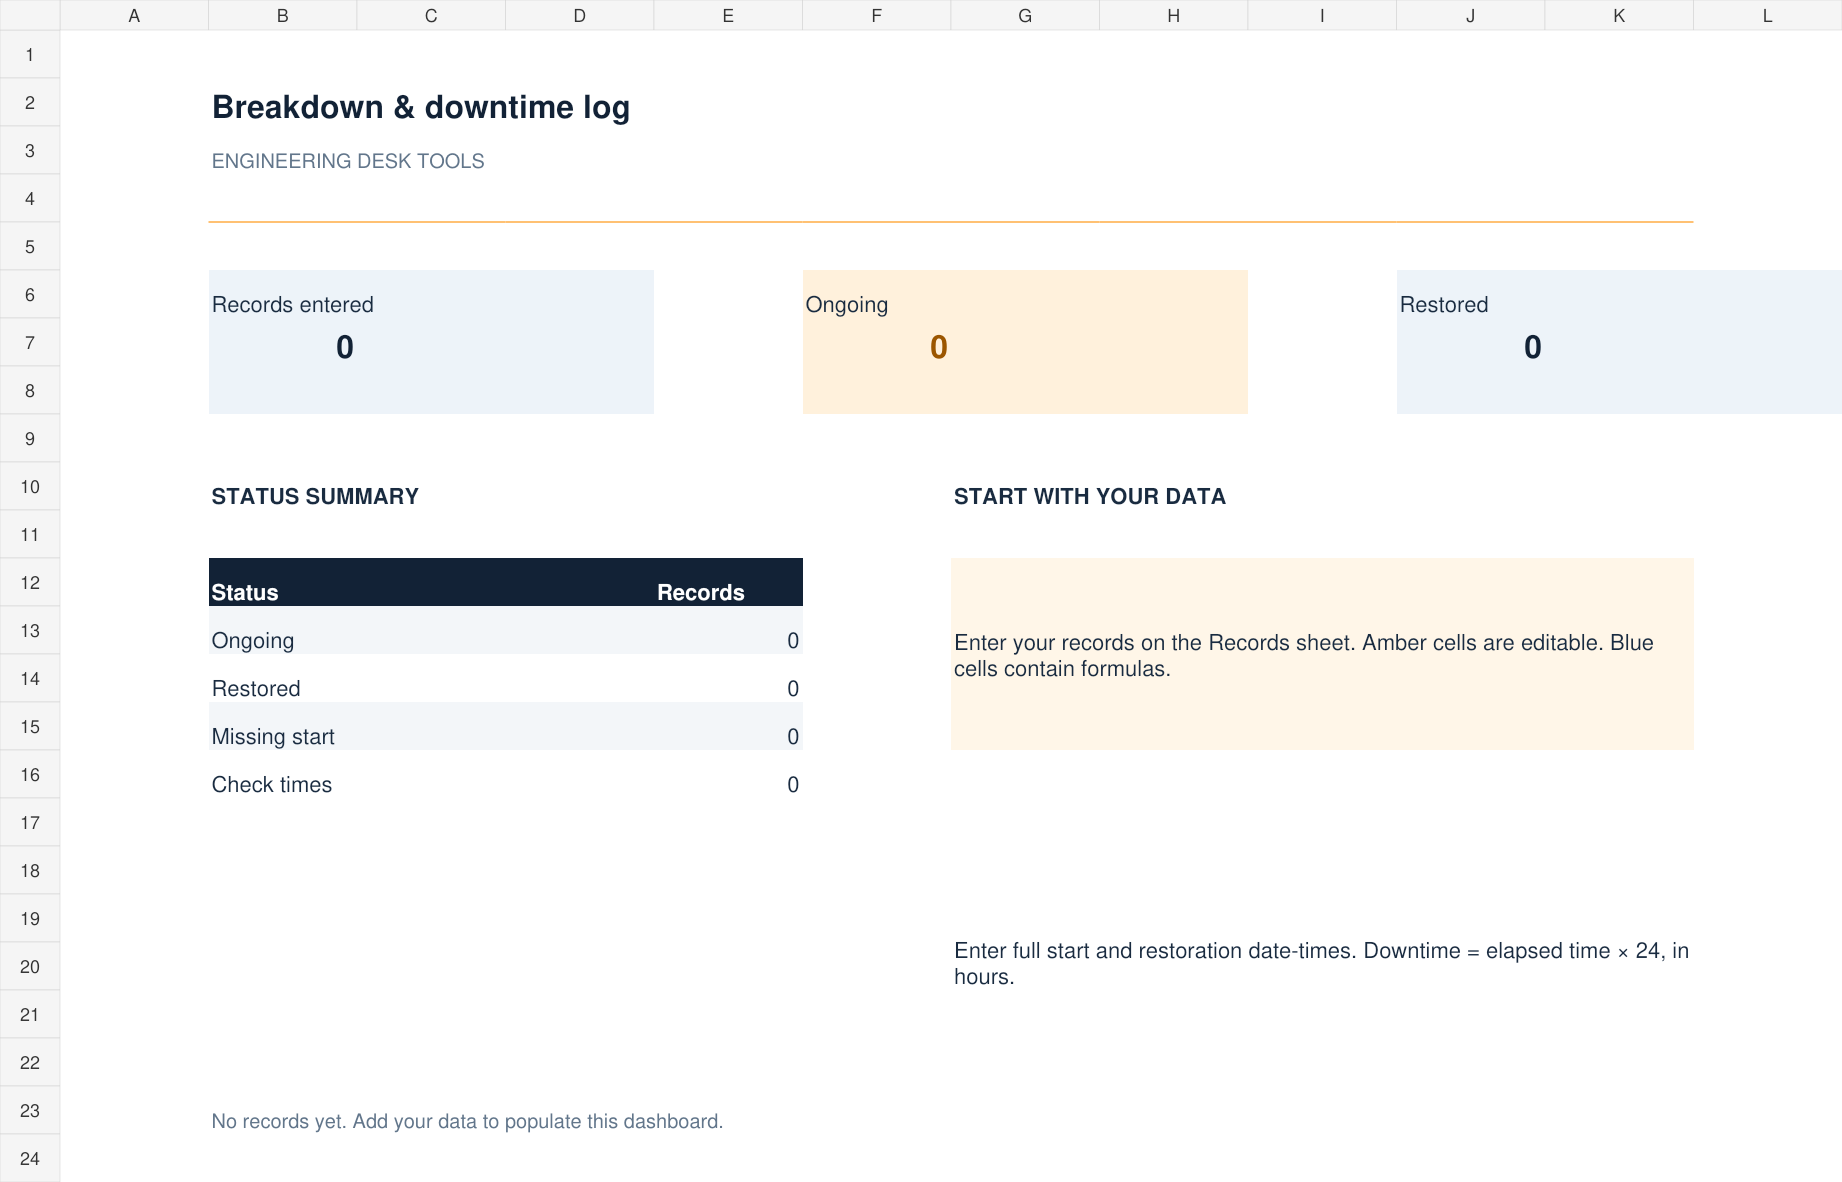
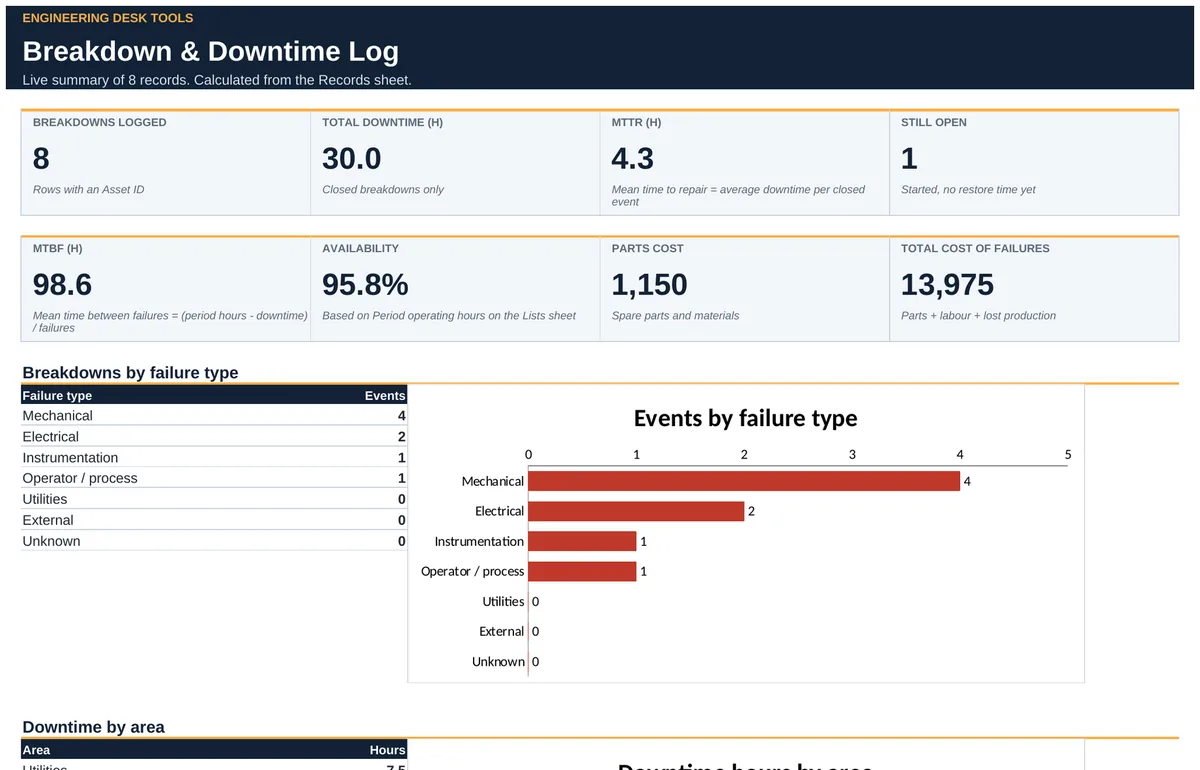
Equipment maintenance log template (breakdowns & repairs)
Log each failure and get downtime, MTTR, MTBF, availability and the cost of failures including lost production.
MTTR & MTBFAvailabilityCost of failuresLongest events
Download Excel ↓Free · 500 rows · 5 sheetsFilled example with sample data ↓XInstrument calibration recordACTUAL SHEET
DashboardRecordsView sheet ↗
EXCEL .XLSXBlank records
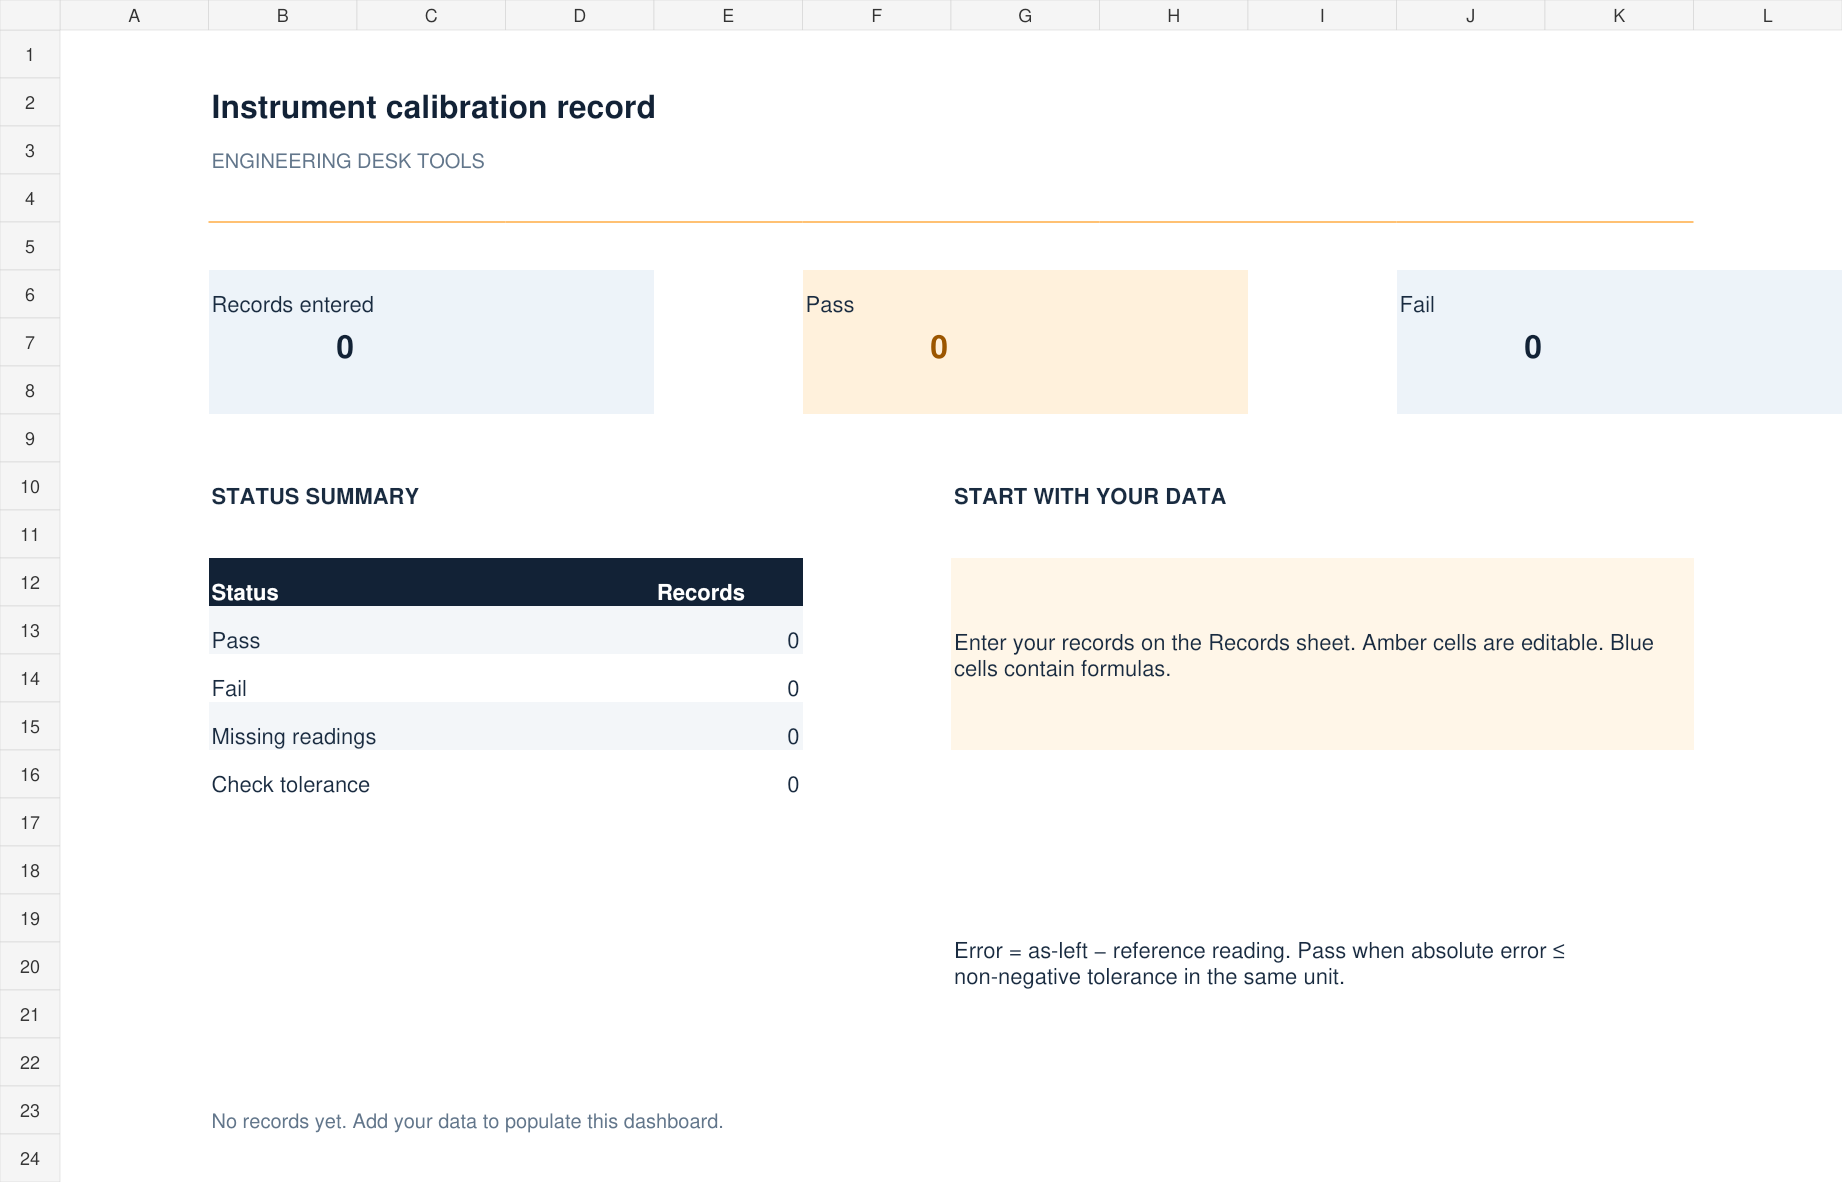
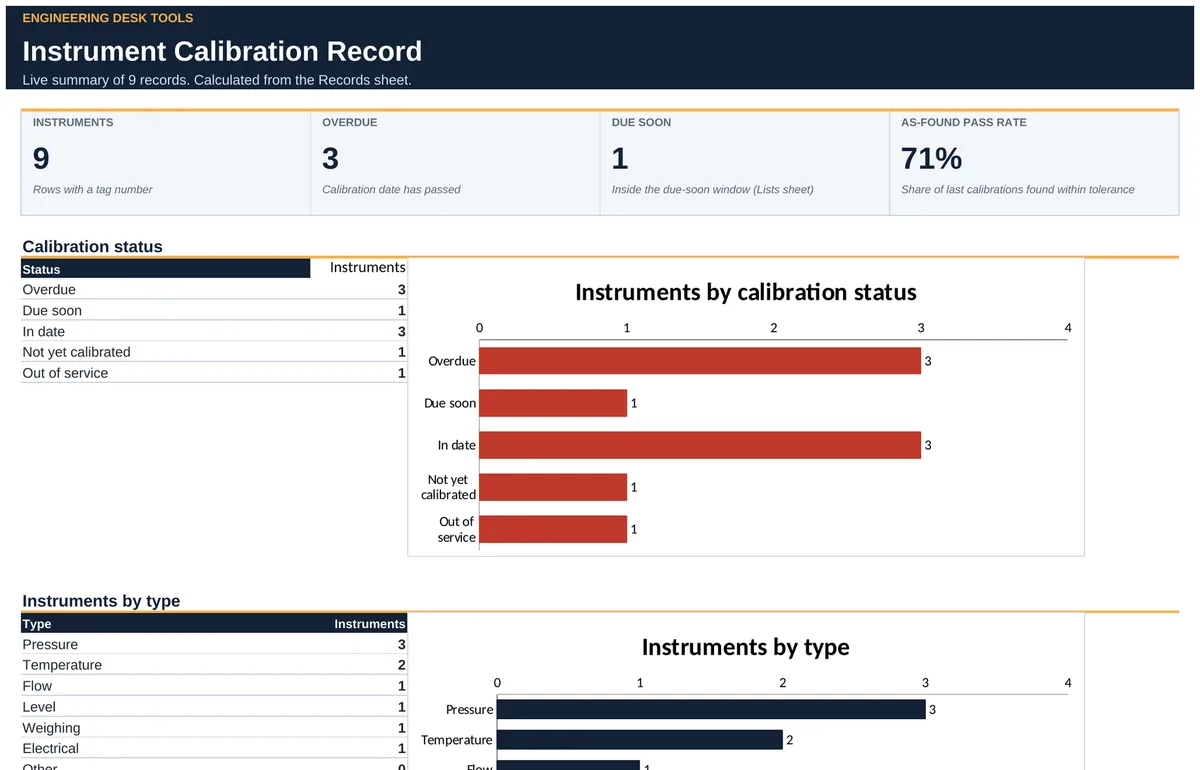
Calibration record template
Track calibration due dates with as-found and as-left pass or fail against tolerance for every instrument.
As-found / as-leftTolerance checksDue-date alertsPass rate
Download Excel ↓Free · 500 rows · 5 sheetsFilled example with sample data ↓XSpare parts registerACTUAL SHEET
DashboardRecordsView sheet ↗
EXCEL .XLSXBlank records
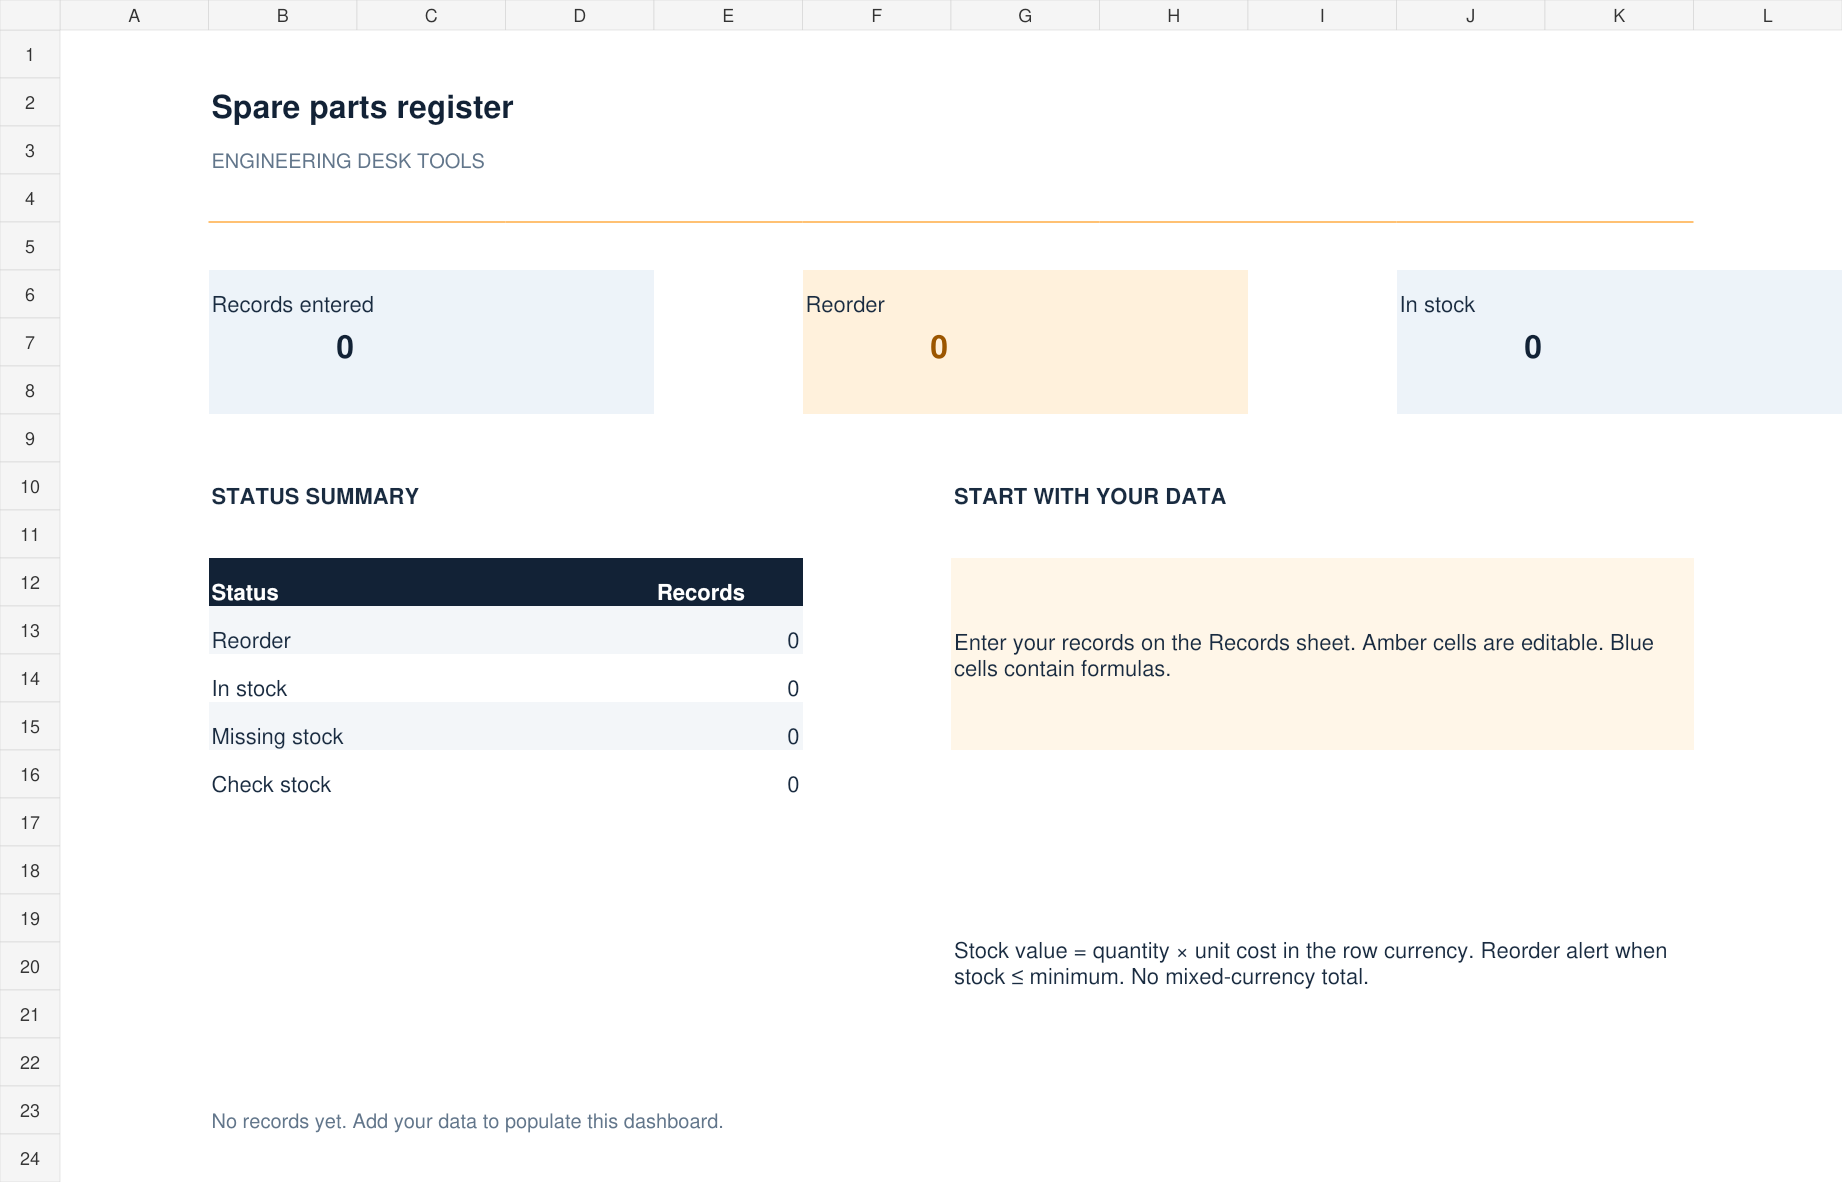
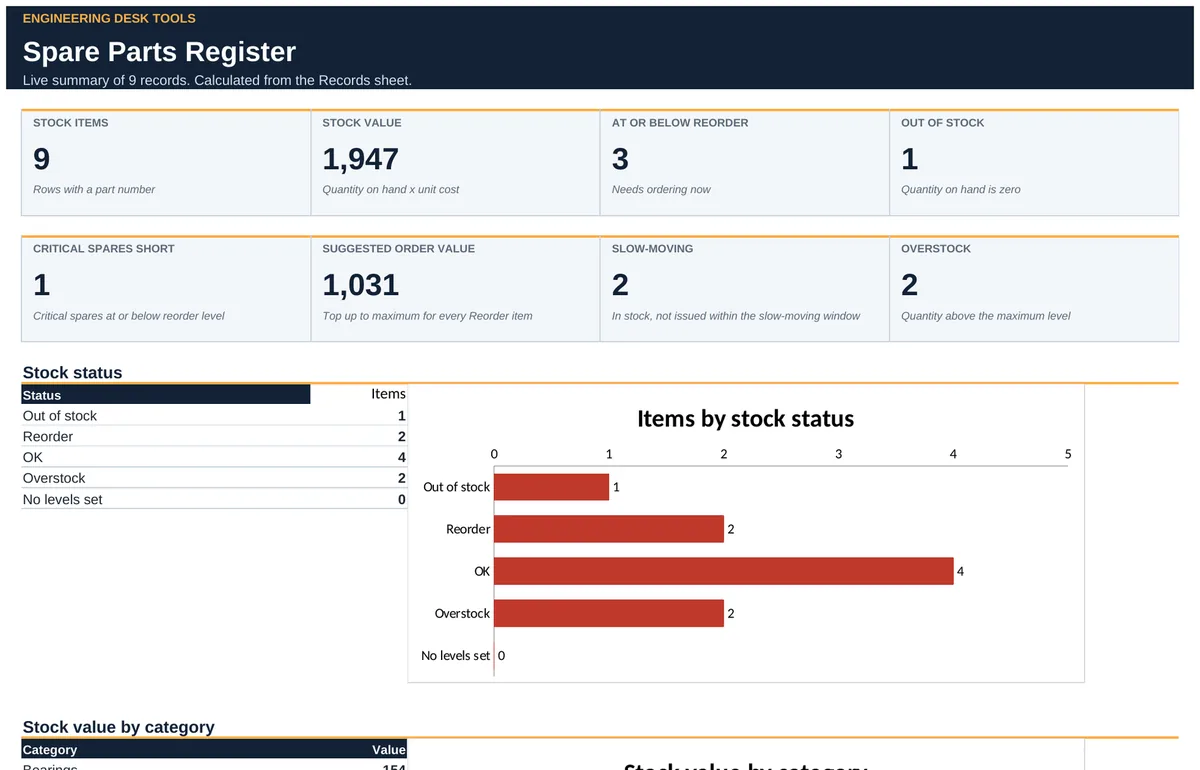
Spare parts register template
Stock levels, reorder alerts, suggested order values, critical spares and slow-moving stock in one register.
Reorder alertsOrder valuesCritical sparesSlow-moving stock
Download Excel ↓Free · 500 rows · 5 sheetsFilled example with sample data ↓XEquipment inspection checklistACTUAL SHEET
DashboardRecordsView sheet ↗
EXCEL .XLSXBlank records
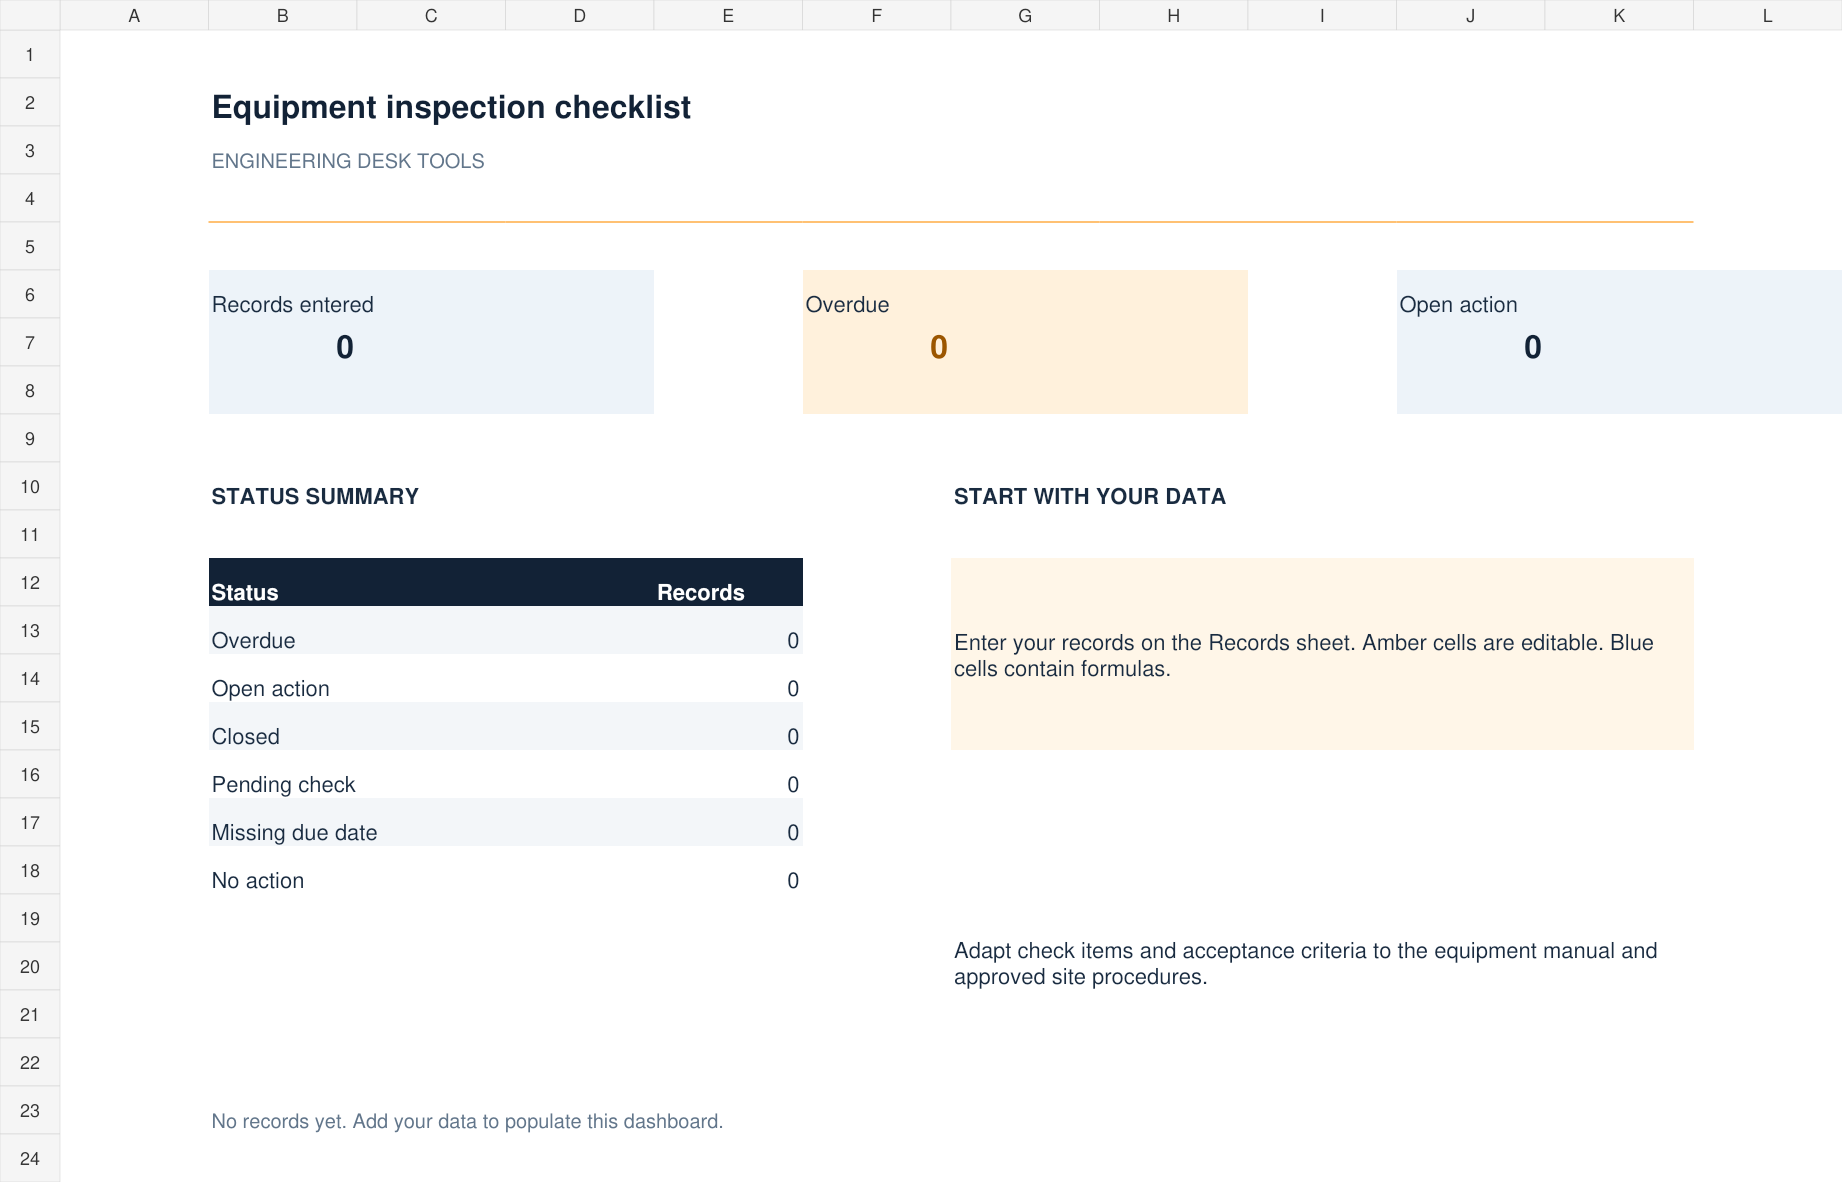
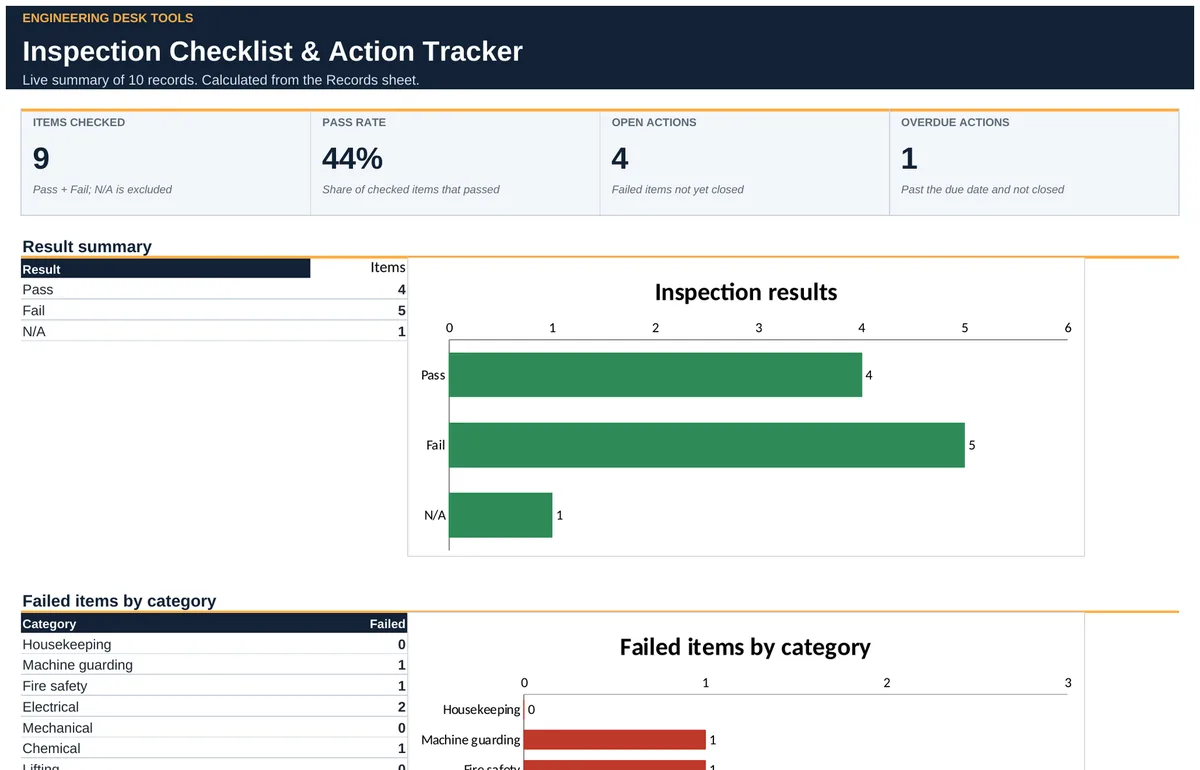
Equipment inspection checklist template
Record Pass, Fail or N/A for every check, set severity-based due dates and chase actions to closure.
Severity due datesAction trackingPass rateOverdue actions
Download Excel ↓Free · 500 rows · 5 sheetsFilled example with sample data ↓XRoot cause & action logACTUAL SHEET
DashboardRecordsView sheet ↗
EXCEL .XLSXBlank records
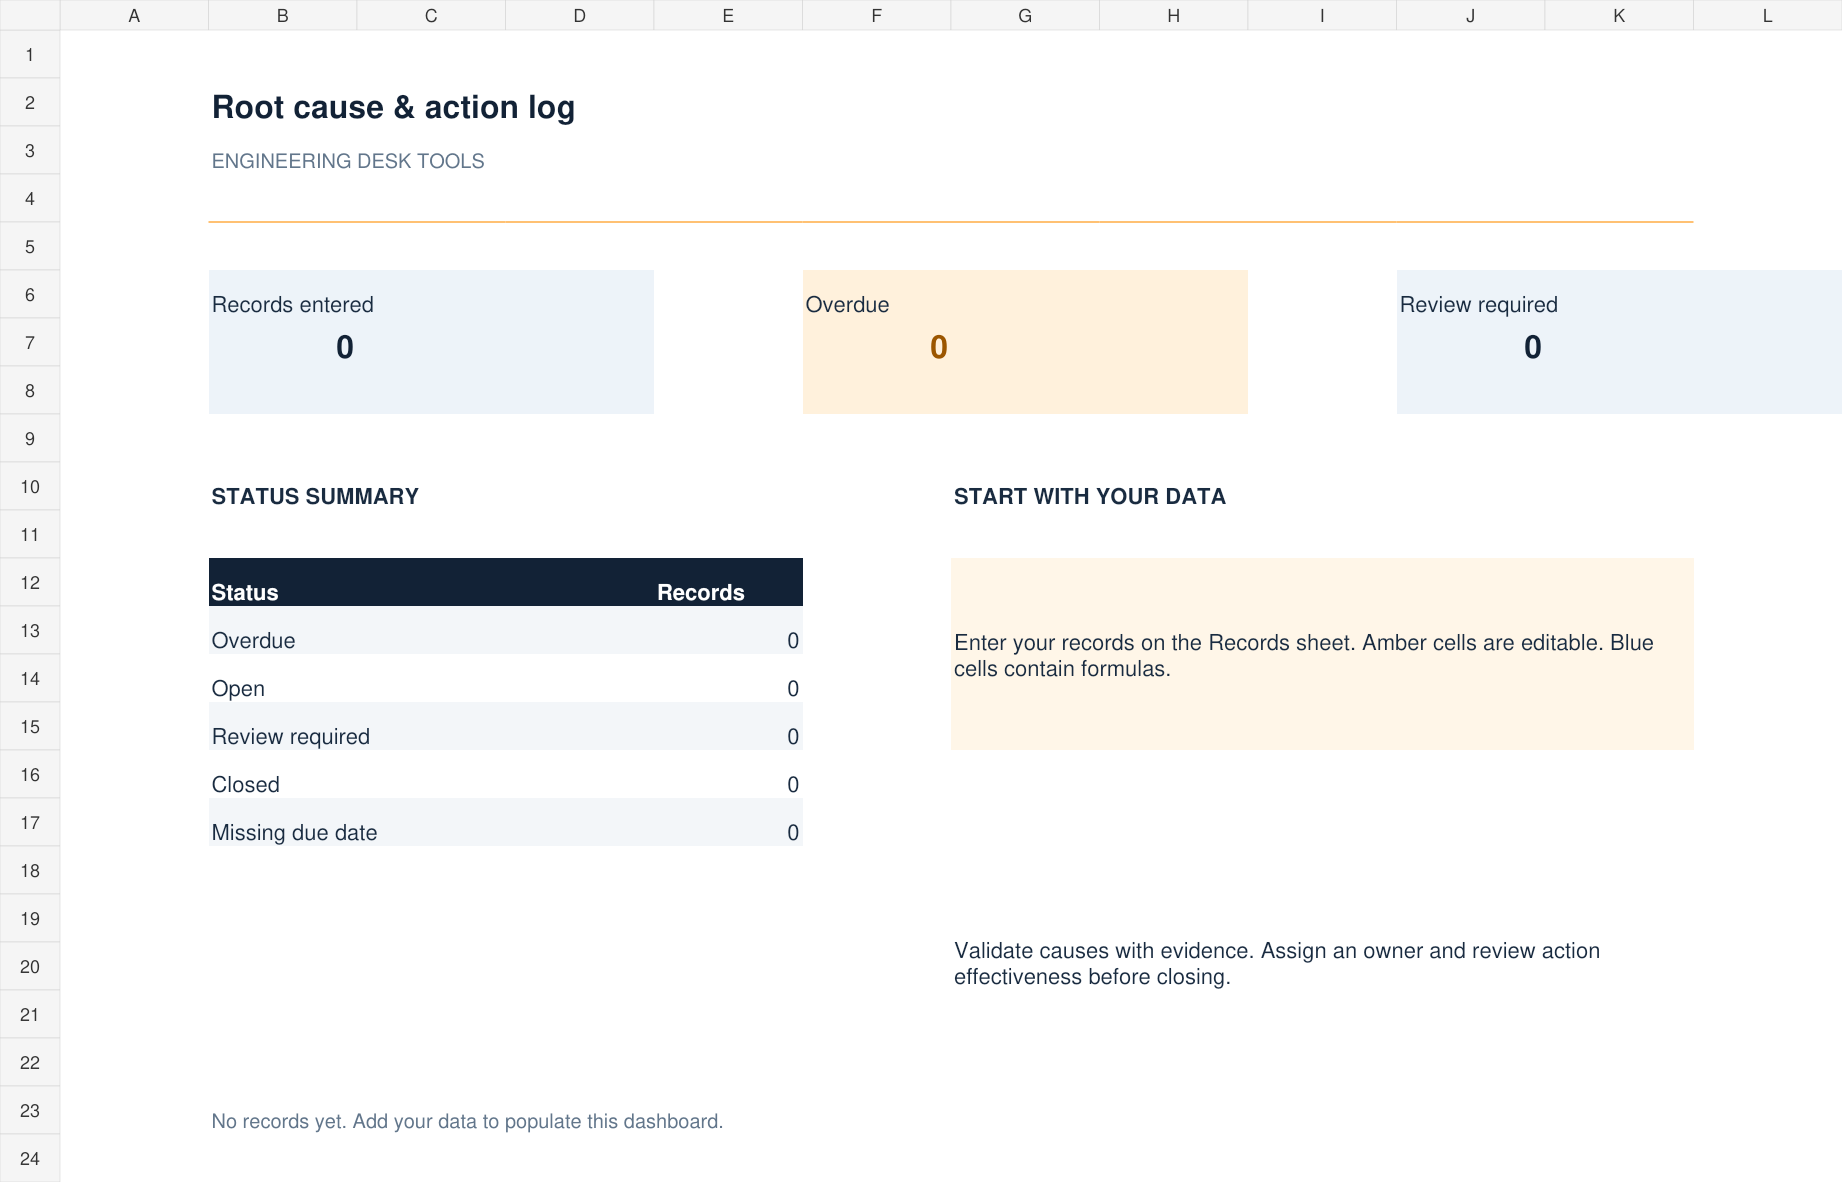
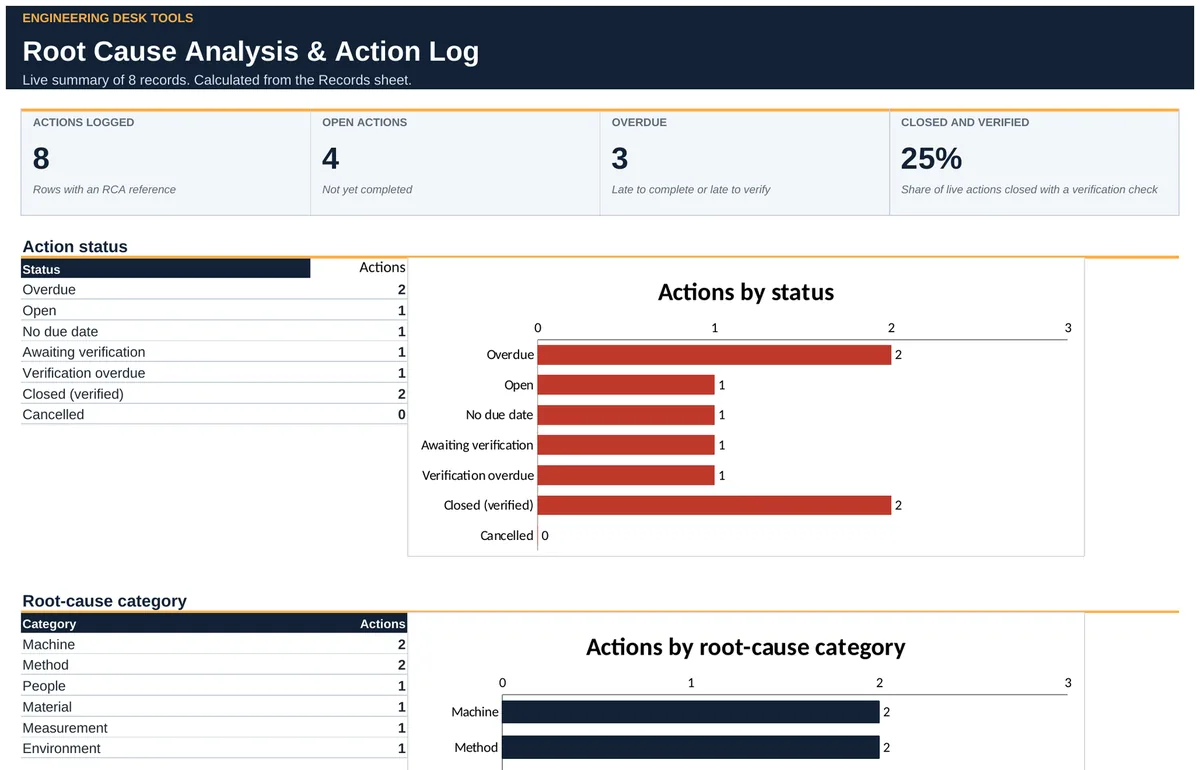
Root cause analysis & corrective action log
Turn each investigation into owned, dated actions that count as closed only once verified.
Verified closureEffectivenessOverdue actionsRoot-cause mix
Download Excel ↓Free · 500 rows · 5 sheetsFilled example with sample data ↓Each blank download opens with 500 empty rows and five sheets: Start Here, Dashboard, Records, Lists and a fictional Example sheet. Amber cells are for your input, blue cells are formulas, and the Lists sheet holds editable settings and dropdowns. Adapt dates, tolerances, task frequencies and approval steps to your site procedures. These templates do not certify maintenance or calibration. Each template also has a filled example with fictional data, so you can see the dashboard working before you enter your own records.
Which maintenance template do you need?
Equipment maintenance log template: what to record
A maintenance log (or maintenance record sheet) should answer four questions for every job: what failed, how long the equipment was down, why it failed and what it cost. Record the time the breakdown started and the time the equipment was back in service, not only the time spent on the repair, otherwise downtime and availability come out too good. Use the same asset IDs as your PM schedule so you can see which machines keep breaking down despite planned work.
This log is for breakdowns and corrective repairs. Planned work and its completion dates are kept in the PM schedule, so the two files together give the maintenance history of each asset. If the restore time is earlier than the start time, the row shows Check dates and is left out of the downtime figures until it is corrected.
The log spreadsheet calculates downtime per event, MTTR, MTBF, availability and the total cost of each failure, including lost production if you enter a cost per hour. For the formulas behind those figures, see the MTBF and MTTR calculator and the breakdown log guide.
Preventive maintenance schedule template: setting frequencies
Start from the manufacturer's intervals, then adjust them with your own history. If a task keeps finding nothing, the interval can usually be longer. If failures happen between tasks, shorten it or add a condition check such as vibration or thermography. Write each task so a technician can do it without guessing: what to check, the acceptable limits and the tools needed.
The schedule is rolling. Until a task is done, its due date is the planned date. Once you enter the actual completion date, the next due date becomes the completion date plus the interval, so a job done late moves the next one later. Cancelled tasks drop out of the overdue count and the on-time rate.
In the schedule format, the frequency list runs from daily and weekly up to every 5 years, and you can type your own interval in days. Two settings on the Lists sheet control the alerts: tasks due within 7 days show as due soon, and a task finished up to 3 days late still counts as on time. Change both to match how your site plans. The preventive maintenance Excel guide walks through a full schedule, and the maintenance KPI calculator shows how PM compliance is worked out.
Preventive maintenance checklist: example items to start from
A checklist is only useful if failed items turn into actions. In the inspection checklist template each Fail gets a severity, and the suggested due date follows from it: critical in 1 day, major in 7 days and minor in 30 days by default. Keep each check short and something a person can see or measure. The rows below are typical starting points for an industrial machine checksheet; replace them with the manufacturer's checks and your own site rules.
Use the Category column (electrical, mechanical, lifting, fire safety and so on) to group items, so the dashboard shows which area fails most often. Review the list when equipment, procedures or the people doing the checks change.
Root cause analysis template: 5 whys and corrective actions
A root cause analysis is finished only when the actions are done and you have checked that they worked. The RCA template records the problem statement, the method used, the verified root cause and one row per action, marked as containment, corrective or preventive. An action counts as closed only when it has a completed date, a verified date and is marked Effective. If the check shows it was not effective, the action goes back to open against its due date. If a completed action is not checked within 30 days, it shows as verification overdue.
A short 5 whys example for a pump that tripped on high bearing temperature:
- Why did the pump trip? The drive-end bearing overheated.
- Why did it overheat? It was running with too little grease.
- Why was there too little grease? The lubrication task was not done for three months.
- Why was it missed? The pump was installed during a project and never added to the PM schedule.
- Why was it not added? There is no step to add new assets to the PM schedule at handover.
The root cause is the missing handover step, not the bearing. The corrective action is to add the pump to the schedule; the preventive action is to put "add to PM schedule" on the project handover checklist. This is an illustrative example, not a real incident. For ranking failure modes before they happen, see the FMEA RPN calculator.
Calibration record and spare parts register
The calibration record template keeps one row per instrument with its range, tolerance as a percentage of span, last calibration date and interval. Enter the worst as-found and as-left errors and it marks each instrument pass or fail and shows when the next calibration is due. Range max must be above range min; if not, the row shows Check range instead of a result. The calibration error calculator works out the error for a single test point.
The spare parts register is a simple maintenance register for stores: quantity on hand, reorder level, maximum level, unit cost, lead time and whether the part is a critical spare. It flags parts below their reorder level, suggests an order quantity and value, and highlights slow-moving stock. It does not deduct parts already on order, so check open purchase orders before you order. Set reorder levels with the reorder point calculator.
Monthly maintenance report and KPI dashboard in Excel
Each workbook has its own Dashboard sheet, a small maintenance KPI dashboard for that type of record. They are separate files, not one combined dashboard, so for a monthly maintenance report copy these figures into your report format. For single KPI calculations, use the maintenance KPI calculator.
Frequently asked questions
Are these maintenance templates really free?
Yes. All six Excel workbooks are free to download and use at work, with no sign-up and no email. Each one opens with 500 blank rows, and each also has a separate filled example file with fictional data.
What should a maintenance log include?
For every job: the asset, when the breakdown started, when the equipment was back in service, the failure type, what failed, the root cause if known, the repair done, labour hours, parts cost and who did the work. The maintenance log template has these columns and works out downtime, MTTR, MTBF, availability and cost for you.
How do I make a preventive maintenance schedule in Excel?
List each asset and PM task, choose a frequency, and enter the planned date. When the task is done, type the actual completion date. The next due date is the completion date plus the interval. The PM schedule template does this with formulas and flags tasks that are overdue or due within the next 7 days.
Is the root cause analysis template a 5 whys template?
Partly. It is a log and action tracker: there is no separate 5 whys worksheet, so you work through the whys on paper or in a meeting and record the result. For each investigation you pick the method (5 Whys, fishbone, fault tree, FMEA or barrier analysis), then record the problem statement, the verified root cause and the corrective and preventive actions. It does not draw a fishbone diagram.
Is there a Word or PDF version of the maintenance log and checklists?
No, the templates are Excel only, because the due dates, alerts and dashboards need formulas. For a printable maintenance log or checklist, print the Records sheet or save it as PDF from your spreadsheet program.
Do the templates work in Google Sheets?
They are standard Excel .xlsx files, and we check every release by recalculating it in LibreOffice Calc. If you import them into Google Sheets, check the dashboard first, because some charts, formatting and formulas may not behave the same.
Can I use these templates to plan a maintenance shutdown?
Yes, together. Put the shutdown jobs in the PM schedule with the shutdown date as the planned date, check parts in the spare parts register before the stop, use the inspection checklist for pre-start checks, and log anything found during the shutdown in the maintenance log.
Start with a guide
Instrumentation4–20 mA scaling: check the transmitter and HMI ranges
Check lower and upper range values, linear scaling and out-of-range signals before interpreting a 4–20 mA reading.
Read guide →MaintenanceMTBF and MTTR: prepare a consistent breakdown log
Define operating time, failure count and repair time consistently before calculating equipment reliability and availability.
Read guide →MaintenanceOEE calculation: check availability, performance and quality
Prepare consistent production-time and count data, calculate the three OEE factors and investigate results above 100 percent.
Read guide →MaintenanceHow to use a preventive maintenance planner in Excel
Build an asset task schedule, enter completion dates and use formula-driven due dates and overdue alerts in the blank PM workbook.
Read guide →MaintenanceSpare parts register: stock, reorder alerts and criticality
Use the Excel register to track quantities, reorder and maximum levels, part value, suppliers and critical spares, with order suggestions and slow-moving stock flags.
Read guide →ElectricalMotor voltage and current imbalance: measurement checks
Compare phase readings without confusing magnitude imbalance with a full power-quality assessment.
Read guide →MechanicalCompressed air leak cost and repair payback
Estimate leakage cost using measured flow, pressure-network hours and your electricity tariff.
Read guide →MaintenanceProduction downtime cost: contribution versus revenue
Estimate event costs without counting recovered production or avoidable costs twice.
Read guide →InstrumentationPt100 RTD resistance and temperature: converting both ways
How the Callendar–Van Dusen equation links Pt100 and Pt1000 resistance to temperature, with worked conversions, wiring error and loop scaling checks.
Read guide →InstrumentationInstrument calibration error: as-found checks in % of span
How to calculate as-found error in engineering units and percent of span, compare it with a tolerance, and record rising and falling test points.
Read guide →MechanicalBearing life L10 explained: from load rating to operating hours
What basic rating life L10 means, how load and speed change it, and what the calculation leaves out before you use it for a replacement plan.
Read guide →MaintenanceFMEA RPN and Weibull reliability: ranking risk and reading failure data
How to score failure modes with severity, occurrence and detection, why RPN has limits, and how Weibull shape and scale describe failure behaviour over time.
Read guide →MaintenanceMaintenance KPIs: PM compliance, planned work and backlog
Define PM compliance, planned work percentage and backlog weeks, then see how the PM planner and breakdown log dashboards report related figures.
Read guide →